
I got my power meter (Garmin Vector) with my new bike in July, and I have been recording my power throughout my rides ever since. I have compiled all my maximal power outputs into a spreadsheet, as seen below. The red line on the table shows the lower threshold of a cat 1 rider; my goal is to get over this line, this season.
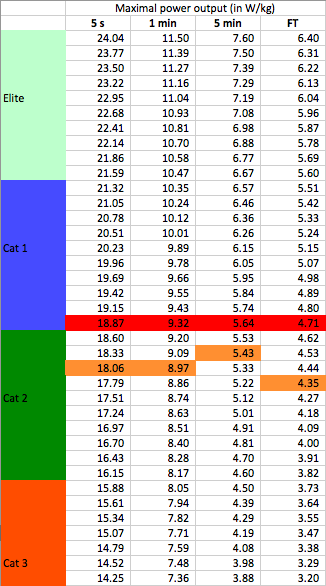
I measure myself in watts per kg (w/kg) and compare my progress against a chart of typical E/1/2/3/4 performance. My training has been going well and over the winter months I have made the following power gains:
- 1 minute power has increased by 151W
- 5 minute power has increased by 75W
- 10 minute power has increased by 48W
- 20 minute power has increased by 63W
- 30 minute power has increased by 62W
- 60 minute power has increased by 39W
I expect the increases to continue, because my winter training has consisted of long, steady rides, helping to increase my fitness and endurance. In the early parts of winter, I constantly rode 200 miles a week to build my base fitness and endurance. As winter progressed, I slowly reduced the distance I rode, but increased the intensity. Anaerobic efforts have played a large part in increasing the intensity, to help prepare myself for the numerous attacks and the attacks I will be creating during races. Or at least that’s the plan 🙂

Great work. Keep it up!
LikeLiked by 1 person
Super site Chris, great results
LikeLiked by 1 person
Thank you Nanny 🙂
LikeLiked by 1 person
Oh for those gains young man 🙂
Great work Chris.
LikeLike
Thanks Richie – I’ll have to gain a lot more until I’ll be at your level 🙂
LikeLike
Great Power to Weight mate
Keep up the training and all the best for the 2015 season
Clarky
LikeLike
Thanks Steve – Looking forward to seeing how you get on too 🙂
LikeLike
Great increase over the winter – sure to see some great times and performances this summer.
LikeLike
Thanks Ian, I hope so 🙂
LikeLike